

Introduction
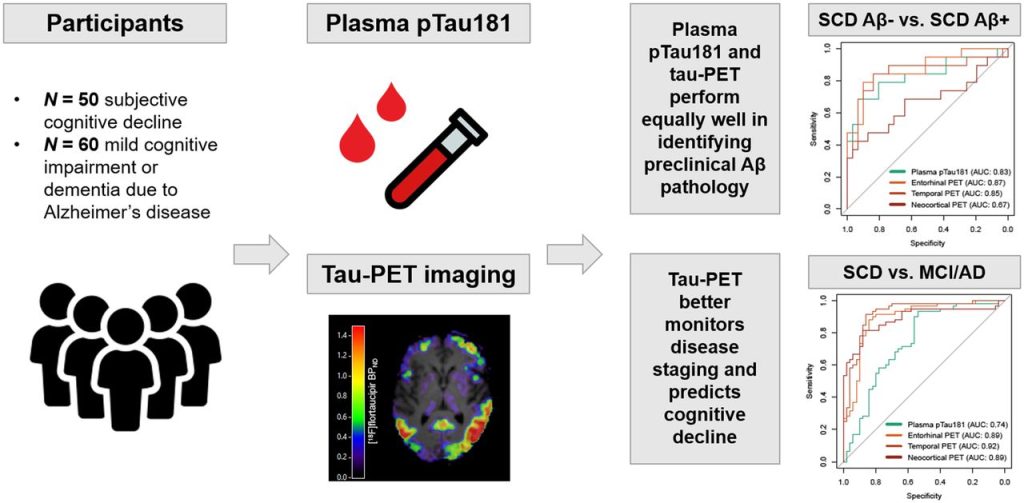
Phosphorylated tau at threonine 181, commonly known as p-tau 181, is an important biomarker investigated in Alzheimer’s disease and broader neurodegenerative disease research. Measuring this protein accurately allows researchers to explore tau-related biological changes, compare experimental groups, and investigate relationships between biomarkers. For quantitative assays, however, detecting the target is only part of the analytical process. The method must also produce dependable measurements across the concentrations expected in the study.
The p-tau 181 linear range is an important consideration because it describes the concentration interval over which an assay demonstrates an acceptable relationship between analyte concentration and measured response. Understanding this range helps laboratories determine whether samples can be quantified reliably, identify when dilution may be necessary, and interpret results with greater confidence. It is therefore a key component of assay validation and quantitative data analysis.
Understanding p-tau 181 and Its Research Significance
Tau is a microtubule-associated protein that helps maintain neuronal structure and supports intracellular transport. Its activity is regulated through several post-translational modifications, including phosphorylation at specific amino acid residues.
P-tau 181 refers to tau phosphorylated at threonine 181. Researchers investigate this molecular form because changes in its concentration have been associated with biological processes studied in Alzheimer’s disease.
P-tau 181 is often examined alongside other biomarkers, including:
- Total tau: Represents the overall tau detected by an assay, regardless of a specific phosphorylation site.
- P-tau 217: Measures tau phosphorylated at threonine 217.
- P-tau 231: Measures tau phosphorylated at threonine 231.
- Amyloid-beta 42 and 40: Used to investigate amyloid-related changes.
- Neurofilament light chain (NfL): Studied as an indicator associated with neuronal injury.
These biomarkers provide complementary information. Their results should be interpreted according to the target measured, sample matrix, analytical method, and research objectives.
What Is the Linear Range of an Assay?
The linear range is the concentration interval over which an analytical method produces a response that follows an acceptably linear relationship with the amount of analyte present.
In a quantitative immunoassay, the measured signal is related to the concentration of p-tau 181 through a calibration process. Within the validated linear range, changes in analyte concentration correspond predictably to changes in the measured response, within predefined analytical limits.
The linear range is important because samples may contain different concentrations of the target. If a sample falls outside the validated range, its measured signal may not support reliable concentration estimation using the established calibration relationship.
Linear Range and Measuring Range Are Not Always the Same
These terms are related but should not be treated as interchangeable.
- Linear range: The interval over which the signal-concentration relationship meets defined linearity criteria.
- Measuring range: The interval over which the method can provide acceptable quantitative results under specified conditions.
- Analytical sensitivity: The ability to detect low concentrations of the target.
- Limit of quantification (LoQ): The lowest concentration that can be measured with predefined acceptable performance.
Some immunoassays use nonlinear calibration models across their measuring range. In such cases, the validated quantitative range may extend beyond a strictly linear interval. Laboratories should therefore follow the assay’s validated calibration model rather than assume that every quantitative immunoassay must be linear throughout its entire measuring range.
Why the Linear Range Matters in p-tau 181 Assay Validation
Establishing an appropriate linear range helps researchers understand where an assay can produce dependable quantitative results.
Reliable Concentration Estimation
When a sample falls within the validated range, its measured signal can be interpreted using the established calibration relationship. This supports more consistent concentration estimates.
Identification of Samples Outside the Range
Samples may contain concentrations below or above the assay’s validated limits. Identifying these results prevents laboratories from reporting unsupported quantitative values.
Consistent Comparison Between Samples
Research studies often compare samples from different experimental groups or collection time points. A validated measuring range helps ensure that these comparisons are based on results obtained under appropriate analytical conditions.
Improved Data Quality
Linearity studies can reveal deviations in assay response that may result from reagent limitations, signal saturation, matrix effects, or other analytical factors.
Better Method Selection
Knowing the expected concentration range of study samples helps laboratories choose an assay with suitable sensitivity and quantitative capacity.
How Quantitative Immunoassays Measure p-tau 181
Many p-tau 181 assays use an antibody-based sandwich format. A capture antibody binds the target, while a second antibody recognizes another region of the molecule. A detection system then generates a measurable signal.
The signal is compared with a calibration curve prepared using standards with known or assigned concentrations. The assay’s validated calibration model is used to estimate the concentration of p-tau 181 in unknown samples.
Several technologies can support this process.
Enzyme-Linked Immunosorbent Assay (ELISA)
ELISA uses enzyme-mediated reactions to produce a measurable color change. It is widely used in protein research and offers an established workflow for quantitative analysis.
Factors affecting its linearity include:
- Antibody binding characteristics.
- Enzyme reaction efficiency.
- Substrate concentration and reaction time.
- Washing consistency.
- Background signal.
- Microplate reader performance.
At high concentrations, signal saturation or limitations in antibody binding can cause deviations from the expected response.
Chemiluminescence Immunoassay (CLIA)
CLIA uses antibody recognition combined with a chemical reaction that generates light. A compatible analyzer measures the emitted signal, which is interpreted using calibration data.
Potential advantages include sensitive signal detection and automation options. However, the quantitative range depends on the complete assay system, including antibody performance, reagent chemistry, calibration, and analyzer characteristics.
Laboratories should verify that the p-tau 181 reagents and analyzer are compatible and that the complete method has been validated for the intended sample type.
Electrochemiluminescence Immunoassay
Electrochemiluminescence uses an electrochemical process to trigger light emission from a detection label. Depending on the platform, it can support sensitive protein measurement and multiplex analysis.
Its linearity and quantitative range are influenced by the detection chemistry, instrument configuration, antibody pair, and sample matrix. Platform-specific validation is necessary before results are compared with other methods.
Key Factors That Influence Assay Linearity
Several analytical and experimental conditions can affect the relationship between p-tau 181 concentration and measured signal.
Antibody Affinity and Specificity
Antibodies determine how effectively the assay recognizes the intended target. Weak or inconsistent binding can affect signal generation, while cross-reactivity may produce responses unrelated to p-tau 181 concentration.
For p-tau 181 testing, antibody recognition of the phosphorylation site is particularly important. Researchers should evaluate:
- Binding to the intended phosphorylated target.
- Cross-reactivity with non-phosphorylated tau.
- Recognition of other phosphorylated tau forms.
- Non-specific interactions with sample components.
- Lot-to-lot consistency.
Signal Saturation
At high analyte concentrations, antibody binding sites or detection components may become limiting. This can cause the measured response to increase less than expected or depart from the validated calibration relationship.
In sandwich immunoassays, very high antigen concentrations can also produce a high-dose hook effect under certain assay conditions. This may lead to unexpectedly low signals and should be investigated where relevant.
Reagent Concentration and Stability
Capture antibodies, detection antibodies, enzyme labels, and signal-generating reagents all influence assay performance.
Incorrect reagent preparation, improper storage, or deterioration may change signal intensity and affect the calibration relationship.
Reaction Time and Temperature
Incubation conditions influence antibody binding and signal development. Inconsistent timing or temperature may introduce variation between samples and analytical runs.
Standardized operating procedures help reduce these effects.
Sample Matrix Effects
Plasma, serum, and cerebrospinal fluid contain different combinations of proteins and other substances. These components may affect antibody binding, signal generation, or analyte recovery.
An assay’s linearity in a buffer-based calibration solution does not automatically establish linearity in biological samples. Matrix-specific studies are necessary.
How to Evaluate Linearity During Assay Validation
A structured linearity study helps determine whether an assay performs acceptably across its intended concentration interval.
1. Define the Intended Measuring Range
The first step is to establish the concentration interval relevant to the research application. This should reflect the expected p-tau 181 concentrations in the intended sample type.
The selected interval should also account for the assay’s detection and quantification limits.
2. Prepare Samples Across the Concentration Range
Researchers can use suitable reference materials, pooled samples, or mixtures of high- and low-concentration samples to create a series of test levels.
The preparation approach should be appropriate for the analyte and sample matrix. Dilution or mixing procedures must not introduce substantial matrix changes that could distort the results.
3. Measure Each Concentration Level
Each prepared level should be tested using an appropriate number of replicates. Replicate measurements help identify random variation and determine whether the assay response remains consistent.
4. Compare Observed and Expected Values
The measured concentrations are compared with expected values based on the preparation scheme or assigned reference concentrations.
Researchers can assess deviations across the interval to identify concentrations where the method no longer meets predefined acceptance criteria.
5. Evaluate the Calibration Model
The response should be assessed using the calibration model specified for the assay.
A linear regression model may be appropriate for a genuinely linear response interval. Other immunoassays may require nonlinear models, such as four-parameter or five-parameter logistic curves.
The selected model should reflect actual assay behavior and be supported by validation data.
6. Establish Acceptance Criteria
Acceptance criteria should be defined before evaluating the study results. They may address allowable deviation from expected concentrations, replicate precision, and performance at the lower and upper limits.
This prevents laboratories from selecting criteria after seeing the results.
Dilution Linearity and Its Importance
Dilution linearity is an important aspect of quantitative assay evaluation. It examines whether measured concentrations remain consistent with expected values when a sample is diluted.
For example, a sample with a concentration above the assay’s validated upper limit may be diluted using an appropriate diluent. The diluted sample is measured, and the result is adjusted using the dilution factor.
A reliable dilution procedure should produce an adjusted concentration that agrees acceptably with the expected value.
Why Dilution Linearity Matters
- It helps evaluate whether samples above the measuring range can be analyzed appropriately.
- It identifies potential matrix-related changes during dilution.
- It supports selection of suitable dilution protocols.
- It helps detect deviations from expected quantitative behavior.
Dilution recovery should be evaluated using the actual sample matrix and assay procedure. A dilution factor should not be applied to an out-of-range result without an established and validated dilution protocol.
Important Analytical Performance Parameters
Linearity is only one part of assay validation. A reliable p-tau 181 method should also demonstrate suitable performance in other areas.
| Parameter | What it evaluates | Importance |
|---|---|---|
| LoB | Background signal | Characterizes blank response |
| LoD | Lowest detectable concentration | Evaluates detection capability |
| LoQ | Lowest reliably quantifiable concentration | Defines lower quantitative limit |
| Precision | Agreement between repeated results | Assesses measurement consistency |
| Accuracy | Agreement with an accepted reference | Evaluates closeness to expected values |
| Specificity | Recognition of the intended target | Helps identify cross-reactivity |
| Linearity | Relationship between concentration and response | Evaluates quantitative behavior |
| Measuring range | Interval of acceptable quantitative performance | Defines usable concentration limits |
| Recovery | Measurement of known added analyte | Helps assess matrix and method effects |
Considering these parameters together provides a more complete picture of assay suitability.
Data Analysis for Linearity Assessment
Appropriate data analysis helps researchers determine whether the assay response meets the predefined performance requirements.
Regression Analysis
Regression analysis can describe the relationship between expected and measured concentrations. For a linear response, the slope and intercept provide information about proportionality and systematic bias.
A slope close to the expected value and an intercept near zero may support linear behavior, but these statistics should not be used alone to establish acceptance.
Residual Analysis
Residuals represent the differences between observed measurements and values predicted by the fitted model.
Examining residual patterns can reveal systematic deviations that may not be obvious from a correlation coefficient.
Correlation Coefficient
A high correlation coefficient indicates a strong association between expected and observed values. However, it does not prove that the method is sufficiently linear or accurate.
A dataset can have a high correlation despite meaningful deviations at the lower or upper ends of the range.
Deviation from Expected Values
Researchers should calculate the difference between measured and expected concentrations at each level. These deviations can then be assessed against predefined acceptance criteria.
Replicate Precision
Replicate results should be reviewed at each concentration level. A method may demonstrate an acceptable overall relationship while showing poor precision at particular concentrations.
Common Causes of Nonlinearity
Several problems can cause assay responses to depart from the expected concentration-response relationship.
| Potential cause | Possible effect | Recommended evaluation |
|---|---|---|
| Signal saturation | Reduced response at high concentrations | Assess upper-range samples and dilution behavior |
| Hook effect | Unexpectedly low signal at very high target levels | Investigate high-concentration samples |
| Matrix interference | Altered signal response | Conduct matrix-specific studies |
| Poor antibody performance | Inconsistent target recognition | Review affinity and specificity |
| Reagent deterioration | Changes in signal generation | Verify reagent stability and storage |
| Inconsistent incubation | Variable binding and reaction development | Standardize timing and temperature |
| Incorrect calibration model | Biased concentration estimates | Evaluate model fit and residuals |
| Inaccurate dilution | Incorrect expected concentrations | Verify preparation and dilution procedures |
Identifying the source of nonlinearity helps laboratories determine whether corrective action is possible or whether the assay’s usable range must be restricted.
Comparing Detection Technologies for Quantitative Performance
Different platforms may produce different response characteristics, even when they measure the same biomarker.
| Technology | Signal type | Quantitative considerations |
|---|---|---|
| ELISA | Colorimetric | Enzyme activity, washing, and substrate development |
| CLIA | Chemiluminescent | Reaction chemistry, analyzer performance, and reagent compatibility |
| Electrochemiluminescence | Electrically triggered light | Platform-specific signal response and calibration |
| High-sensitivity immunoassay | Enhanced or specialized detection | Low-concentration precision and matrix validation |
| Mass spectrometry | Mass-to-charge measurement | Sample preparation, peptide response, and quantitative standards |
The technologies should be compared using appropriate samples, reference materials, and consistent evaluation criteria. A platform’s general technical specifications do not replace validation of the specific p-tau 181 method.
Best Practices for Maintaining Reliable Quantitative Results
Laboratories can improve assay consistency by standardizing analytical procedures and monitoring performance over time.
Recommended practices include:
- Use validated assay reagents and compatible instrumentation.
- Follow established sample collection and storage procedures.
- Prepare calibrators and controls according to validated instructions.
- Maintain consistent incubation and reaction conditions.
- Include suitable quality-control materials in analytical runs.
- Monitor precision across relevant concentration levels.
- Review calibration performance and deviations from expected values.
- Validate dilution procedures before applying them to study samples.
- Document reagent lots, instrument maintenance, and procedural changes.
- Reassess performance when assay components or workflows are modified.
These measures help reduce technical variation and improve confidence in quantitative research findings.
Applications in Neurodegenerative Disease Research
A validated p-tau 181 assay can support several research activities.
Alzheimer’s Disease Biomarker Studies
Researchers examine p-tau 181 alongside amyloid-related biomarkers and other measures to investigate molecular changes associated with Alzheimer’s disease.
Longitudinal Biomarker Research
Repeated measurements can help researchers study how p-tau 181 concentrations change over time. Consistent analytical performance is necessary to distinguish biological changes from measurement variability.
Assay Development and Comparison
Linearity studies help developers compare antibody combinations, detection technologies, and assay formats.
Multi-Biomarker Investigations
P-tau 181 may be measured alongside other biomarkers to explore relationships among different biological processes. Each analyte requires appropriate validation within the overall testing system.
These applications are research-focused. P-tau 181 measurements should not be treated as standalone clinical diagnoses, and clinical use requires appropriate clinical validation and regulatory authorization.
Future Directions in p-tau 181 Assay Validation
Advances in analytical technology may improve quantitative measurement and the evaluation of assay performance.
Improved Detection Chemistry
Developments in chemiluminescence, electrochemiluminescence, and signal amplification may support improved detection of low-abundance proteins.
More Specific Antibody Systems
Improved antibody design may help distinguish phosphorylated tau forms and reduce unwanted cross-reactivity.
Better Standardization
Consistent reference materials, calibration procedures, and validation frameworks may improve comparability between laboratories.
Multiplex Biomarker Platforms
Multiplex technologies may support simultaneous measurement of p-tau 181 and other biomarkers. Their expanded use will require careful assessment of interactions and quantitative performance for each target.
Advanced Data Analysis
Improved statistical approaches may help laboratories identify nonlinearity, evaluate measurement uncertainty, and compare assay performance more comprehensively.
Conclusion
The linear range is a fundamental consideration in p-tau 181 assay validation because it helps establish where quantitative measurements can be interpreted reliably. It supports the evaluation of concentration-response behavior, identification of out-of-range samples, and development of appropriate dilution procedures.
However, linearity must be assessed alongside sensitivity, specificity, precision, accuracy, calibration, and matrix compatibility. Different detection technologies may offer distinct advantages, but their suitability depends on the validated performance of the complete assay system.
By conducting structured linearity studies, defining clear acceptance criteria, and maintaining consistent laboratory procedures, researchers can improve the quality of p-tau 181 measurements and strengthen quantitative investigations into neurodegenerative disease biology.
About Post Author




More Stories
How Iron Castings Manufacturers Meet Custom Industrial Component Requirements
TCCA for Cooling Tower Water: Understanding Chemical Treatment and Microbial Control Requirements
How to Evaluate the Production Capabilities of a Thermal Printer Manufacturer